For the Points, Line and Ellipse methods the user has to manually place markers into the LV center, and all along the central line of the myocardium. This task is performed in the SECTORS page of PCARDM.
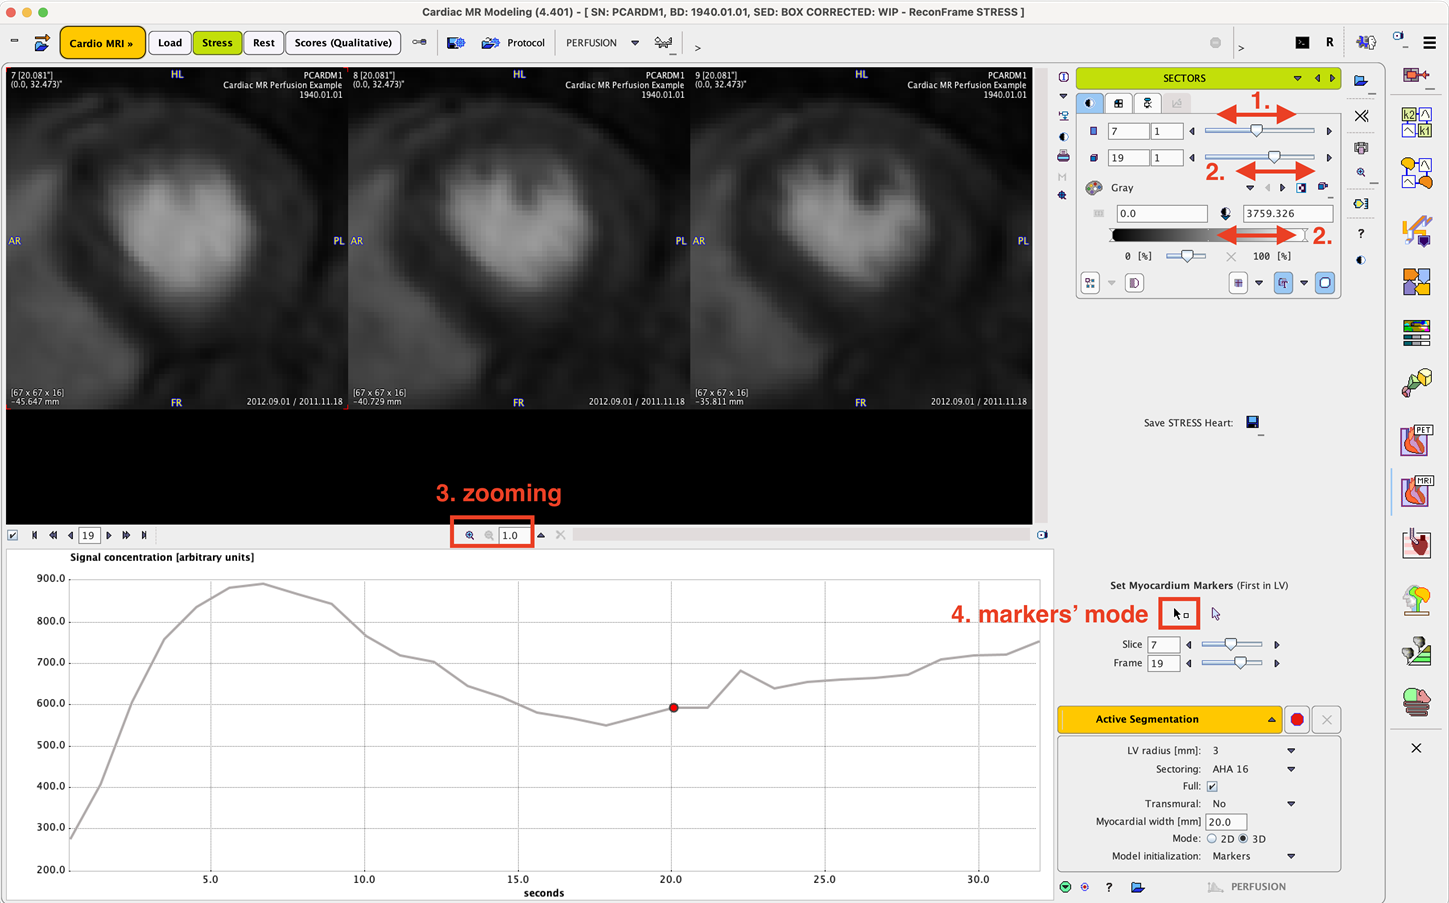
Please proceed as follows:
1.Adjust the slices slider (1.) so that the first basal slice to be assessed appears to the left in the image area.
2.Optimize the image contrast for identifying the myocardium by changing the time of the dynamic acquisition (2.) or the upper threshold level (2.).
3.Zoom the images so that the myocardium wall is shown clearly. To this end enable the zoom button to the right of the image (3.). In the appearing boundary area use the zooming functionality to enlarge the image. Then disable zooming mode again with the zoom button (3.)
4.Activate the button for markers definition (4.).
5.With the left mouse button, first click into the center of the LV, next to the point in the myocardial wall where the RV ends, and continue clicking in clockwise direction along the center of the myocardium (5.). Set the last marker close to the first. Note: It is very important to exactly proceed in this manner.
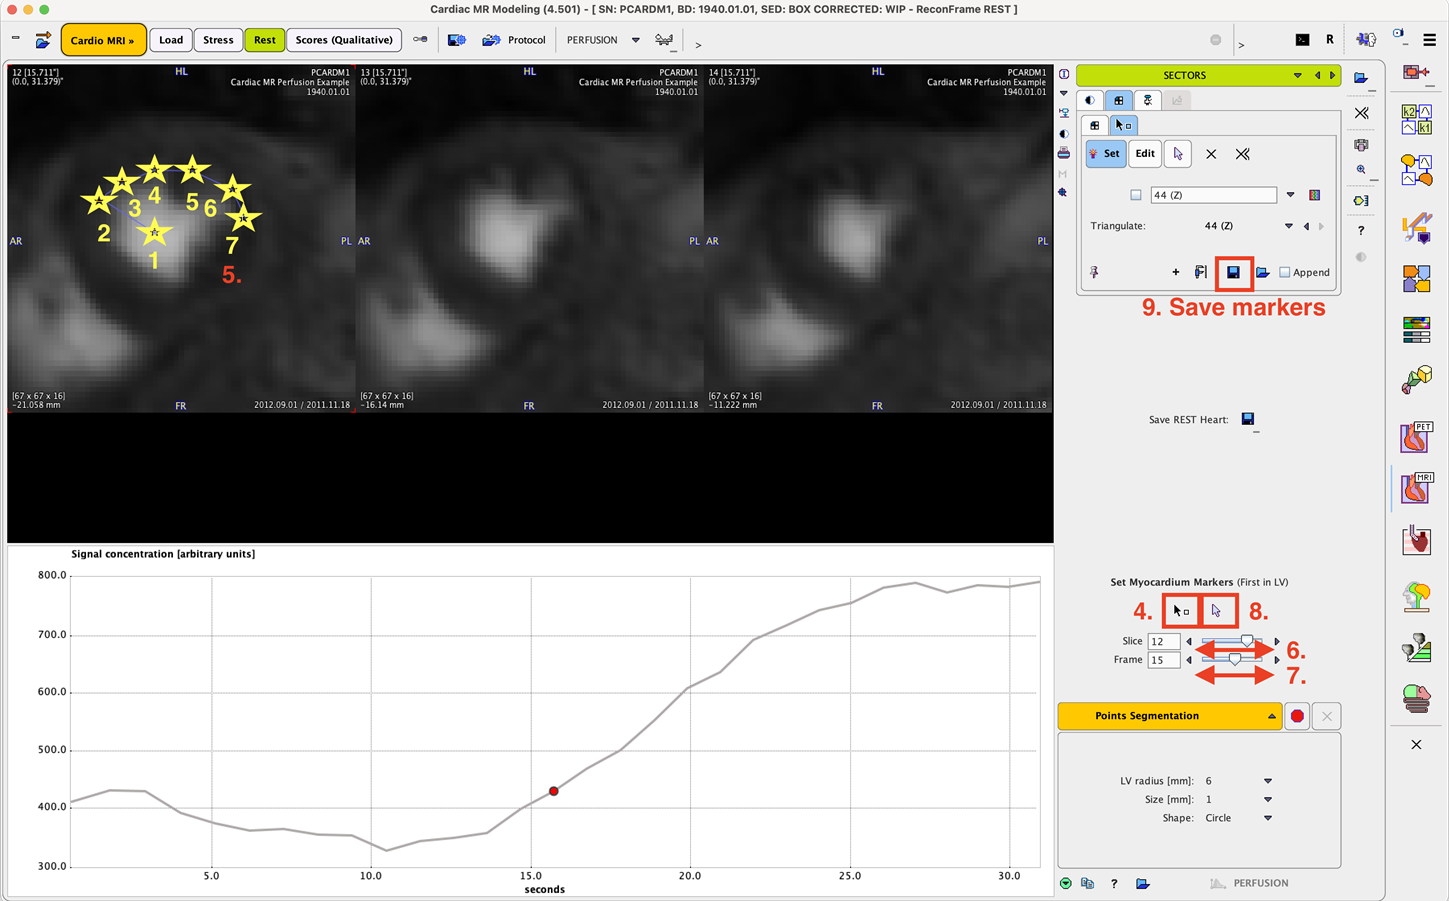
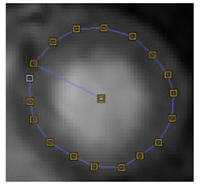
6.Perform the same marker definition in the two other visible slices.
7.Use the Slice increment button (6.) to show the following three slice images and define the markers in the same way. Continue until all slices are processed.
8.In order to verify the markers location on different acquisitions use the Frame slider to shift times.
9.If there is a need to avoid markers generation activate the Neutral mode button (8.) In order to continue marker placement just activate the markers button (4.) again.
10.After all markers have been set it is highly recommended saving them in a definition file (9.)
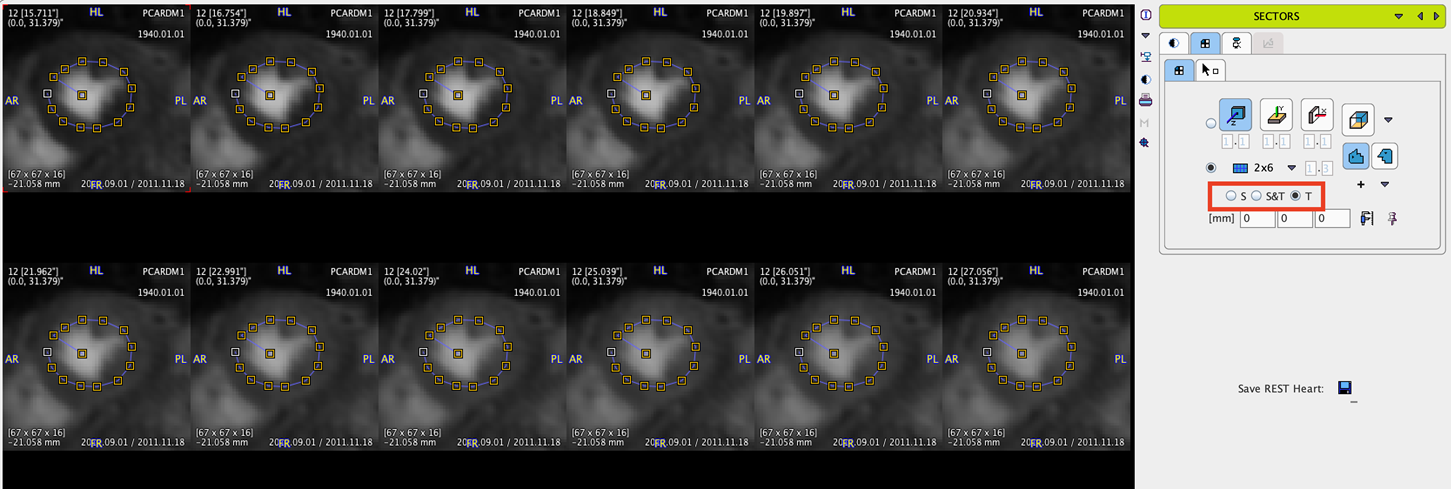
At this time the resulting definition can be visualized as follows. First enable the pushpin on the markers panel so that the markers are always shown, even when the panel is hidden.
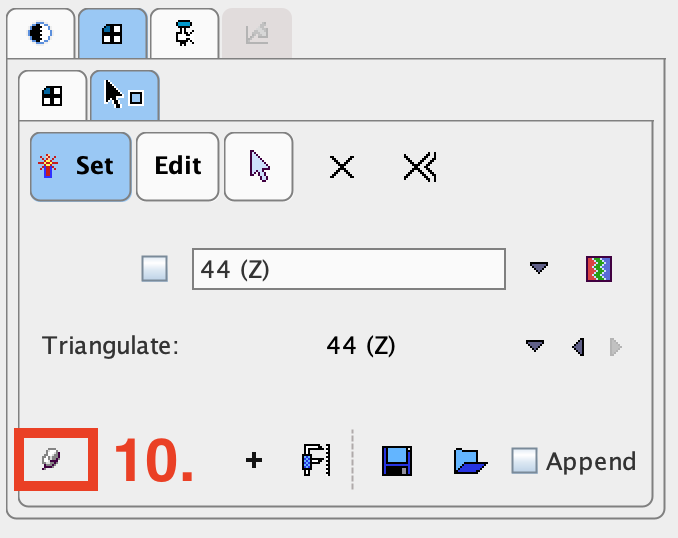
Then switch the layout such that it shows more slices.
The next step consists of configuring and applying the actual segmentation.