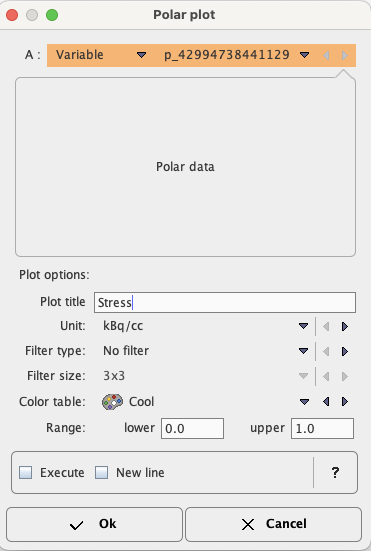
The polar plotting function is called with the ![]() button and opens the following dialog window:
button and opens the following dialog window:

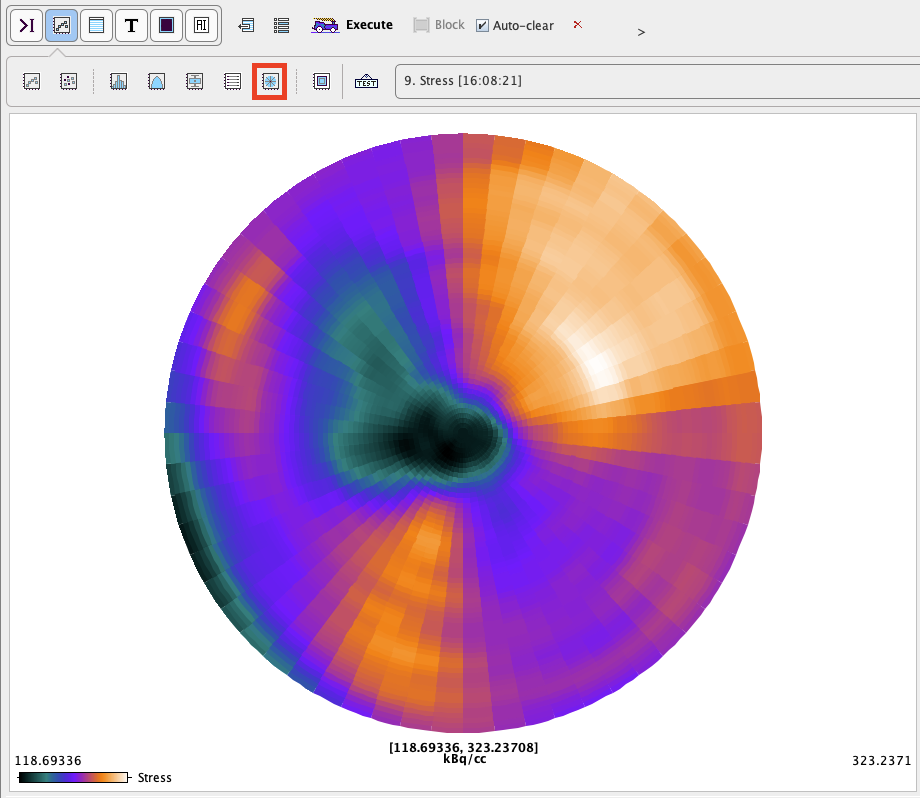
The user interface allows tailoring it to the plotting task and Plot options for the selected Variable are available. The result is shown below

|
<< Click to Display Table of Contents >> Navigation: R Statistics in PMOD > Plotting Layout > Polar Plots |
The polar plotting function is called with the ![]() button and opens the following dialog window:
button and opens the following dialog window:

The user interface allows tailoring it to the plotting task and Plot options for the selected Variable are available. The result is shown below
