Box plots are widely used in descriptive statistics. They are particularly useful for comparing populations. The ![]() button opens the box plot interface.
button opens the box plot interface.
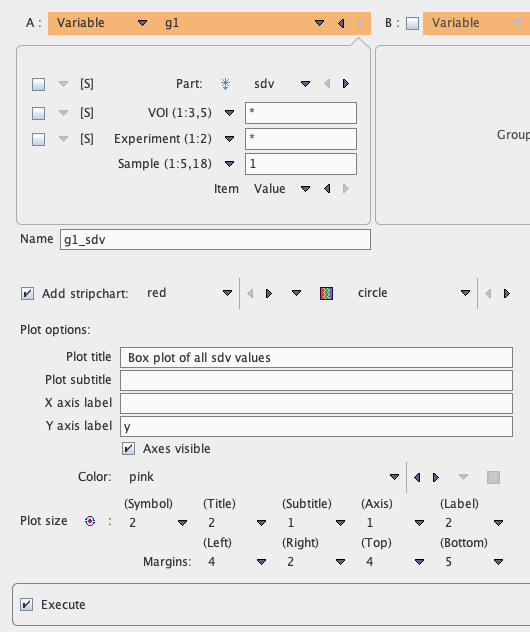
It produces from the data vector a plot with the following structure.
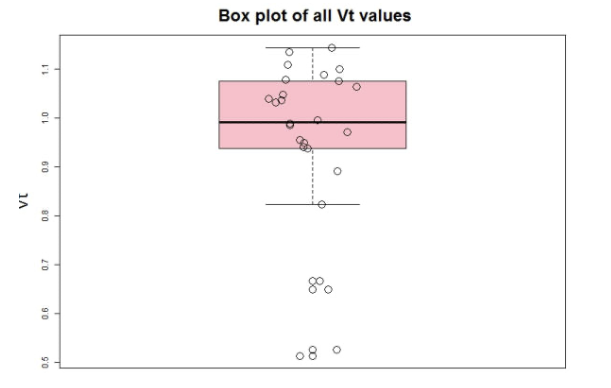
The lines of the box represent the first and third quartiles (Q1, Q3). The bold line in the box represents the median. The whiskers are calculated from the data according to Tukey's method from the interquartile distance (Q3-Q1) and the data. Data points outside the whisker range are outliers.
Note that the box plot is applied in the Descriptive Statistics script.