The first tab in the main controls contains most functions to modify the way how the images and the overlay information look like.

Control of Slice(s)
The slice control section allows scrolling through the images using the increment buttons, the slider, or directly by entering a slice number. The value right to the number of the active slice controls incrementing. This is particularly relevant in multi-image layouts. For example, if the increment value is set to 2, only every second image will be displayed.
Instead of selecting slices using the controls, the user can also scroll slices by dragging the left mouse button over the image holding the CTRL key in the Up/Down direction (see the summary of shortcuts below), or with the mouse wheel.
The frame control section only becomes active for dynamic studies with multiple time frames and behaves the same way as the slice control. To allow for mouse-operated scrolling over time, the time box on the left side below the image must first be checked.![]()
Note: There is a quick way for jumping to the particular slice/frame containing the maximal pixels value: just click the buttons ![]() /
/![]() next to the slice/frame selection.
next to the slice/frame selection.
Color Tables
There is a selection of pre-defined gray and color tables which can be chosen with the list selection.

Note: A new user defined color table can easily be be added. Create a 3-column text file with the RGB values and saving it to the sub-directory resources/colortables (see the examples there). They are appended to the lower section of the color table list such as PETCT in the example above.
A minimal/maximal threshold value defines the range of displayed values. The thresholds can be entered numerically, or the handles in the color bar can be dragged with the mouse. Additionally, the user can modify them by dragging the left mouse button over the image holding the SHIFT key. Left/Right movements modify the lower threshold, while Up/Down movements modify the upper window.

Note: Double-clicking into the lower end of the color bar sets the lower threshold to zero. Double-clicking into the upper end of the color bar sets the upper threshold to the maximum.
Zooming into Color Table
In some cases, the range of image values of interest only covers a small part of the color bar which makes it difficult to adjust the brightness precisely. In this situation, the user can zoom the color bar into the current sub-range of values. Clicking the right mouse button into the color bar pops up the context menu

The first menu entry Expand lt/ut then performs the desired task and makes the color bar change to
![]()
The second entry performs the reverse operation, and the other entries are just shortcuts which may be helpful. The last option in the list allows copying the colorbar image to clipboard.
Color Table Modes
Several modes are available for the color table application. They can be selected using the option button

The different modes are:
|
Inversion of the color table order. |
|
Slice mode: The same % threshold is applied to each individual slice. Hereby the dynamic color range is fully exploited per slice. However, the same color will represent a different value in different slices. Therefore, this mode is not recommended in most cases. |
|
Frame mode: With this setting, the minimal/maximal value in an entire frame is determined, and the % threshold applied to them. As a consequence, the colors represent fixed values when inspecting the slices of a frame. However, as the absolute minimal/maximal value will vary at different times of a dynamic acquisition, the same color will most likely represent different values when comparing different frames. This setting is recommended for static studies. |
|
Study mode: With this setting, the minimal/maximal value in the entire series is determined, and the % threshold applied to them. This setting is recommended for dynamic series and movies because the same color represents the same value at all times and in all slices. |
|
Fixed mode: This setting allows the user entering arbitrary minimal/maximal values which need not belong to the data range. |
|
This button allows saving or retrieving a color table configuration.
|

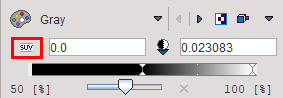
Image Display in SUV Units
If all the relevant information is present for a data set the display units can be switched from original units to SUV with the button indicated below.
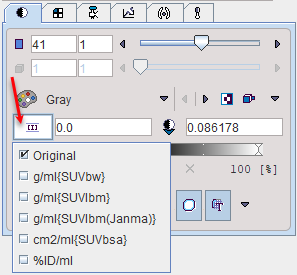
The image unit symbol changes and the color bar units are converted accordingly.
Information Overlays and Image Smoothing
The lowest row contains several control buttons.

All of the buttons can be on or off, and some might have some configuration options attached. Their functionality is:
|
Smoothing: Enables a temporary 9-point smoothing filter. The smoothing is only for display purposes and does not affect calculations. |
|
Interpolation: Enables image interpolation. Interpolation is needed because in most situations the resolution of the display viewport differs from the original image matrix.
If this button is off, the original rectangular pixels are shown. The three interpolation options are Triangle, BSpline, Mitchell (Default). Note: the smoothing/interpolation functions serve only for image display enhancement. Statistical analyses are always performed with the original pixel values. |
|
Grid: Enables a grid centered at the origin of the data set. Bold lines indicate the location of the image origin. The grid size can be defined by the option (50,20,10,5,1mm or from 1 pixel to 10 pixels with 1 pixel increment). |
|
VOIs: Enables the displays of VOI contours, if there have any been defined for the current series. |
|
Overlay: A toggle to switch off all overlay information at once. Its option menu allows defining the level of information included in the overlay display as illustrated above.
Allows displaying the colorbar selected for the image. |

